WindBorne Tropical Cyclone Intercepts: Expanding Our Capabilities
On this page
This summer, WindBorne successfully intercepted the eye of Typhoon Dolphin with one of our Global Sounding Balloons (WindBorne's long-duration weather balloon, which changes altitude to steer and collects soundings around the world.) in the Western Pacific. To our knowledge, this is the first time such a balloon maneuver was done in a A rotating storm that forms over warm tropical oceans, called a hurricane, typhoon, or cyclone depending on where it occurs.. Less than a month later, we made our second interception in the eye of Typhoon Saudel. We are sharing the balloon data described in this blog at the end.
So you may be wondering, why is this a big deal?
Traditionally, National Oceanic and Atmospheric Administration, the U.S. federal agency responsible for weather forecasting, ocean monitoring, and climate science. and the U.S. Air Force fly aircraft reconnaissance missions into hurricanes in the Atlantic and East Pacific regions. These missions are quite expensive, considering staffing costs, weather equipment, and limited flight range and hours. WindBorne’s constellation of balloons, Atlas, has two advantages here: our balloons are cost-effective for getting data inside hurricanes, and they allow us to reach areas that routine reconnaissance missions cannot, such as the West Pacific, Indian Ocean, and the Southern Pacific.
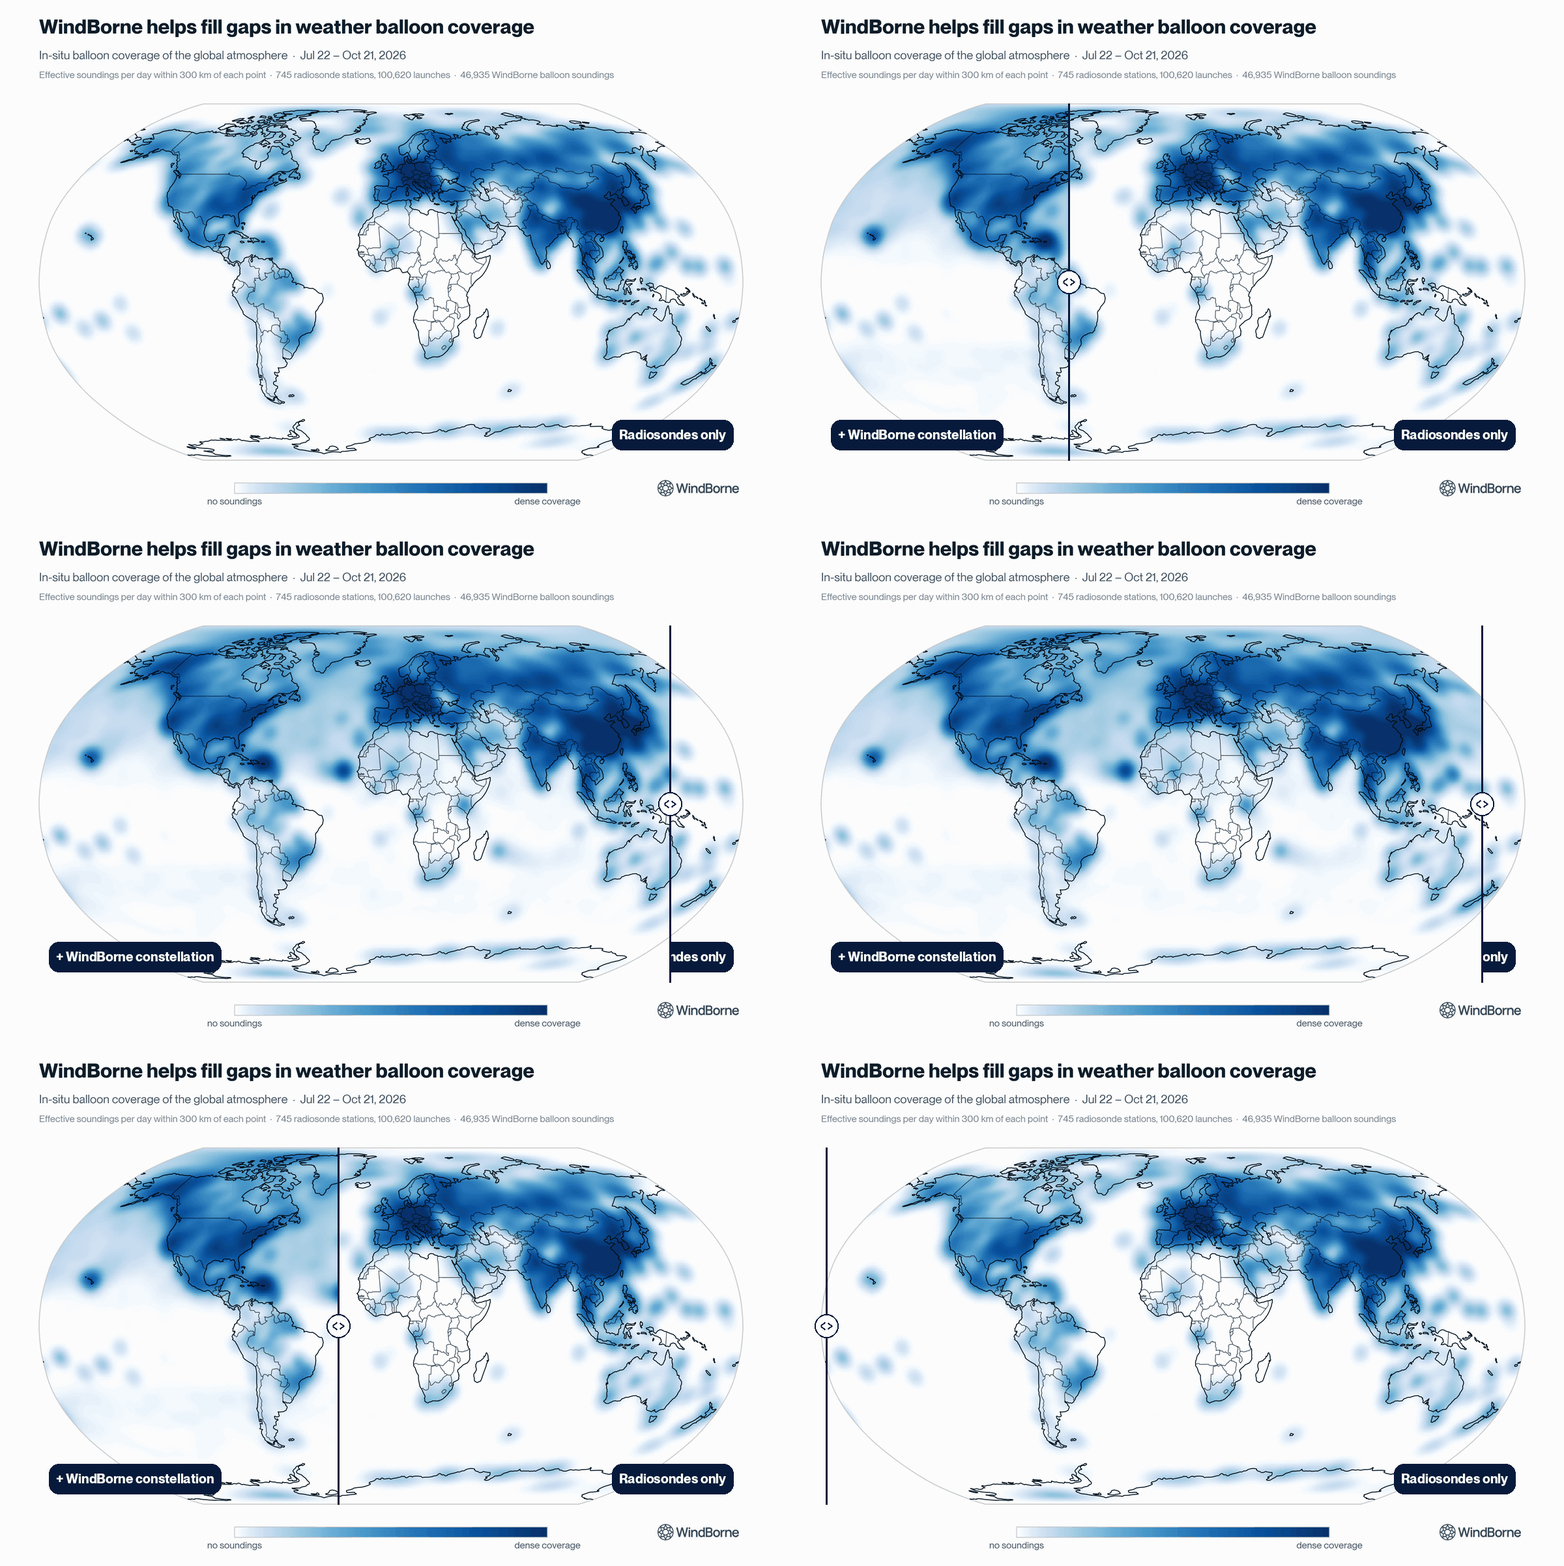
Our data has already shown benefits for tropical cyclone forecasting. NOAA found that ingesting our observations into the Global Forecast System, NOAA's main physics-based global weather model, with forecasts that are free and publicly available. model led to an 18% increase in tropical cyclone track forecast How much better a forecast performs than a simple baseline, such as climatology. (and this was back in 2022 when we had far fewer balloons in the air). Intercepting a cyclone is only possible when we have a balloon nearby, only then can our team navigate the balloon towards the storm by changing altitude. As our constellation continues to scale, we expect to have more opportunities to collect targeted observations in and near tropical cyclones, and see more improvements that help deliver a better weather forecast for everyone.
Typhoon Bavi: Our First Intercept Attempt
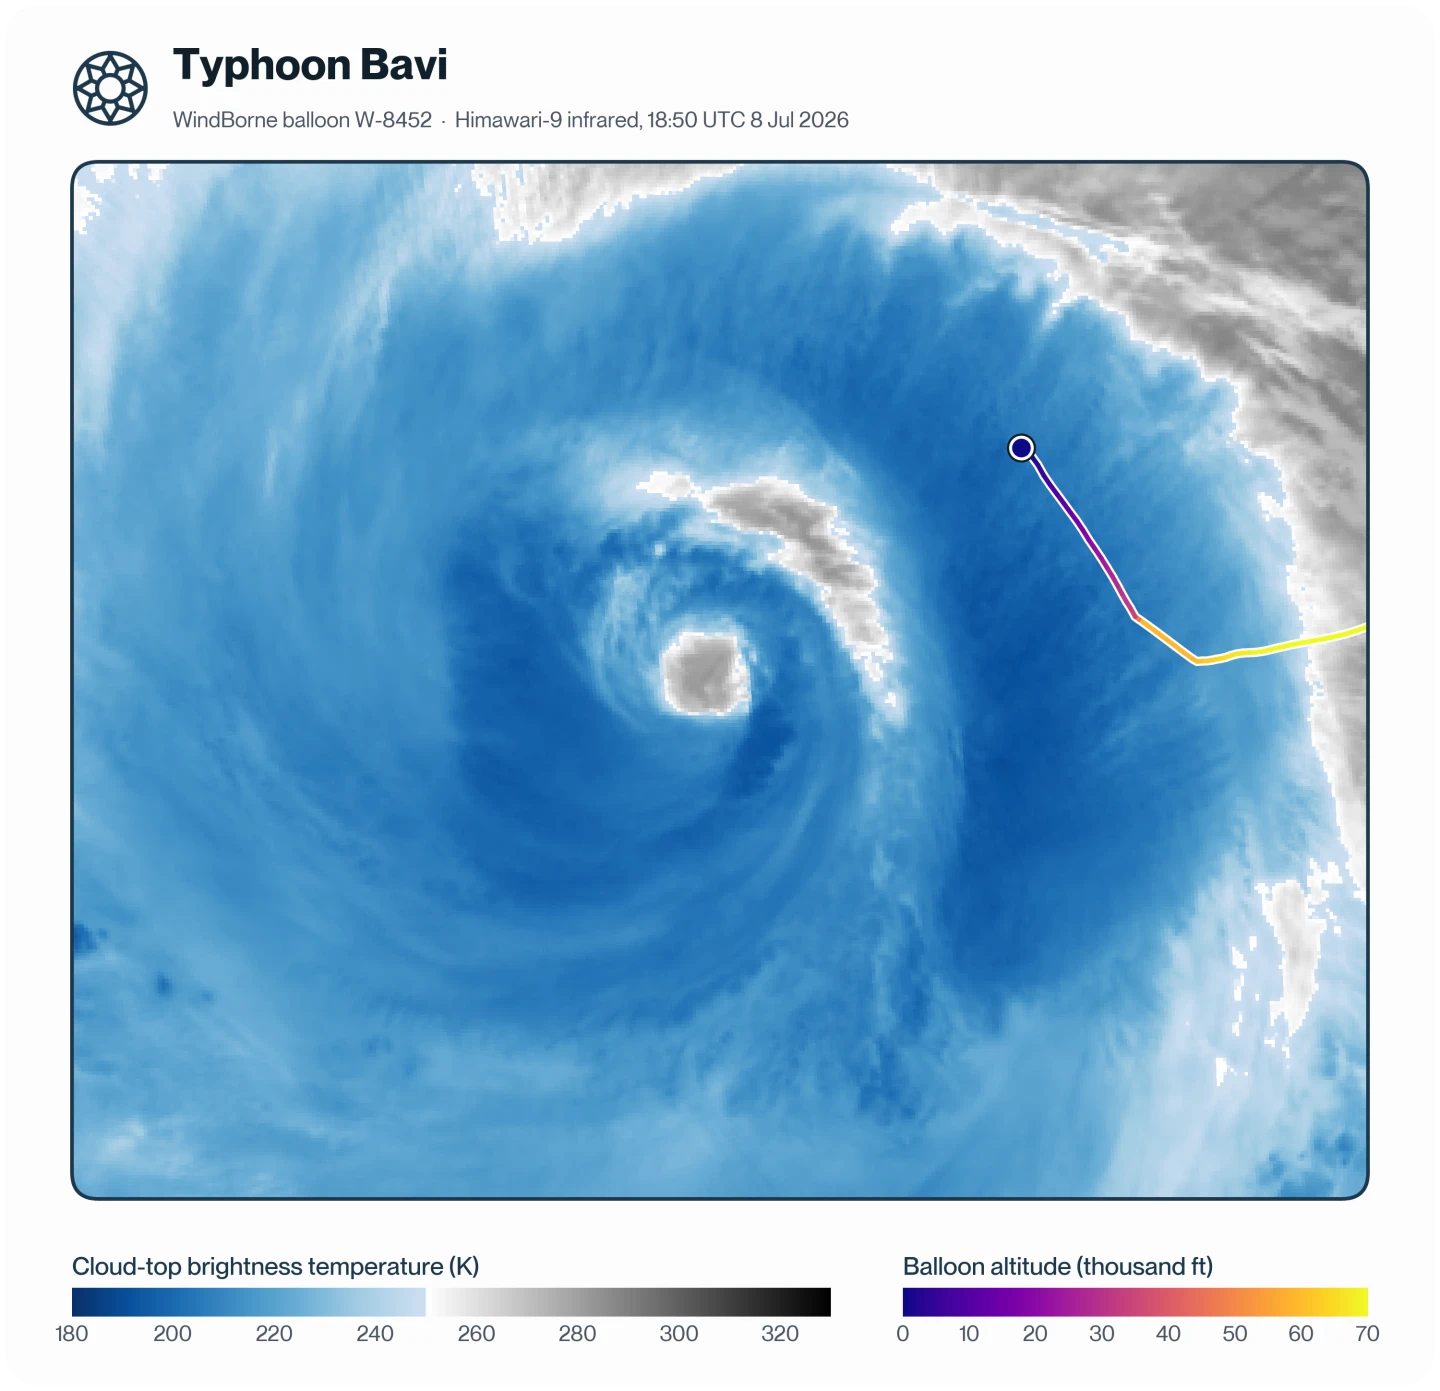
Typhoon Bavi was a Category 5-equivalent super typhoon in early July 2026, reaching an impressive peak wind speed of 180 mph. It grew unusually large in size as its intensity slowly weakened. One of WindBorne’s GSBs was in the vicinity, and we took this opportunity to try to navigate this balloon into Bavi’s eye. As this was our first attempt at an intercept in 2026, our tools and experience were not fully developed, and the balloon ended up on track to miss the eye to the south. We attempted to correct course by slightly descending in the lower The layer above the troposphere, from about 10 to 50 km up, where the air is dry and stable and temperature rises with height./upper The lowest layer of the atmosphere, reaching about 10 to 15 km up, where nearly all weather happens. region to take advantage of steering flow from the SE. But then, a deep convective burst rapidly developed and expanded, bringing our balloon down into the outer bands of the typhoon.
Typhoon Bavi Data:
Estimated minimum MSLP at landing (estimated 222 km away from storm center): 983.9 ± 2.9 Hectopascal, the unit meteorologists use for air pressure, with sea level averaging about 1013 hPa.
Maximum wind speed: 92 kt at 1,571 m altitude
Lowest-level wind speed: 63 kt at 55 m altitude
Typhoon Dolphin: Our Second Attempt / Successful Eye Intercept!
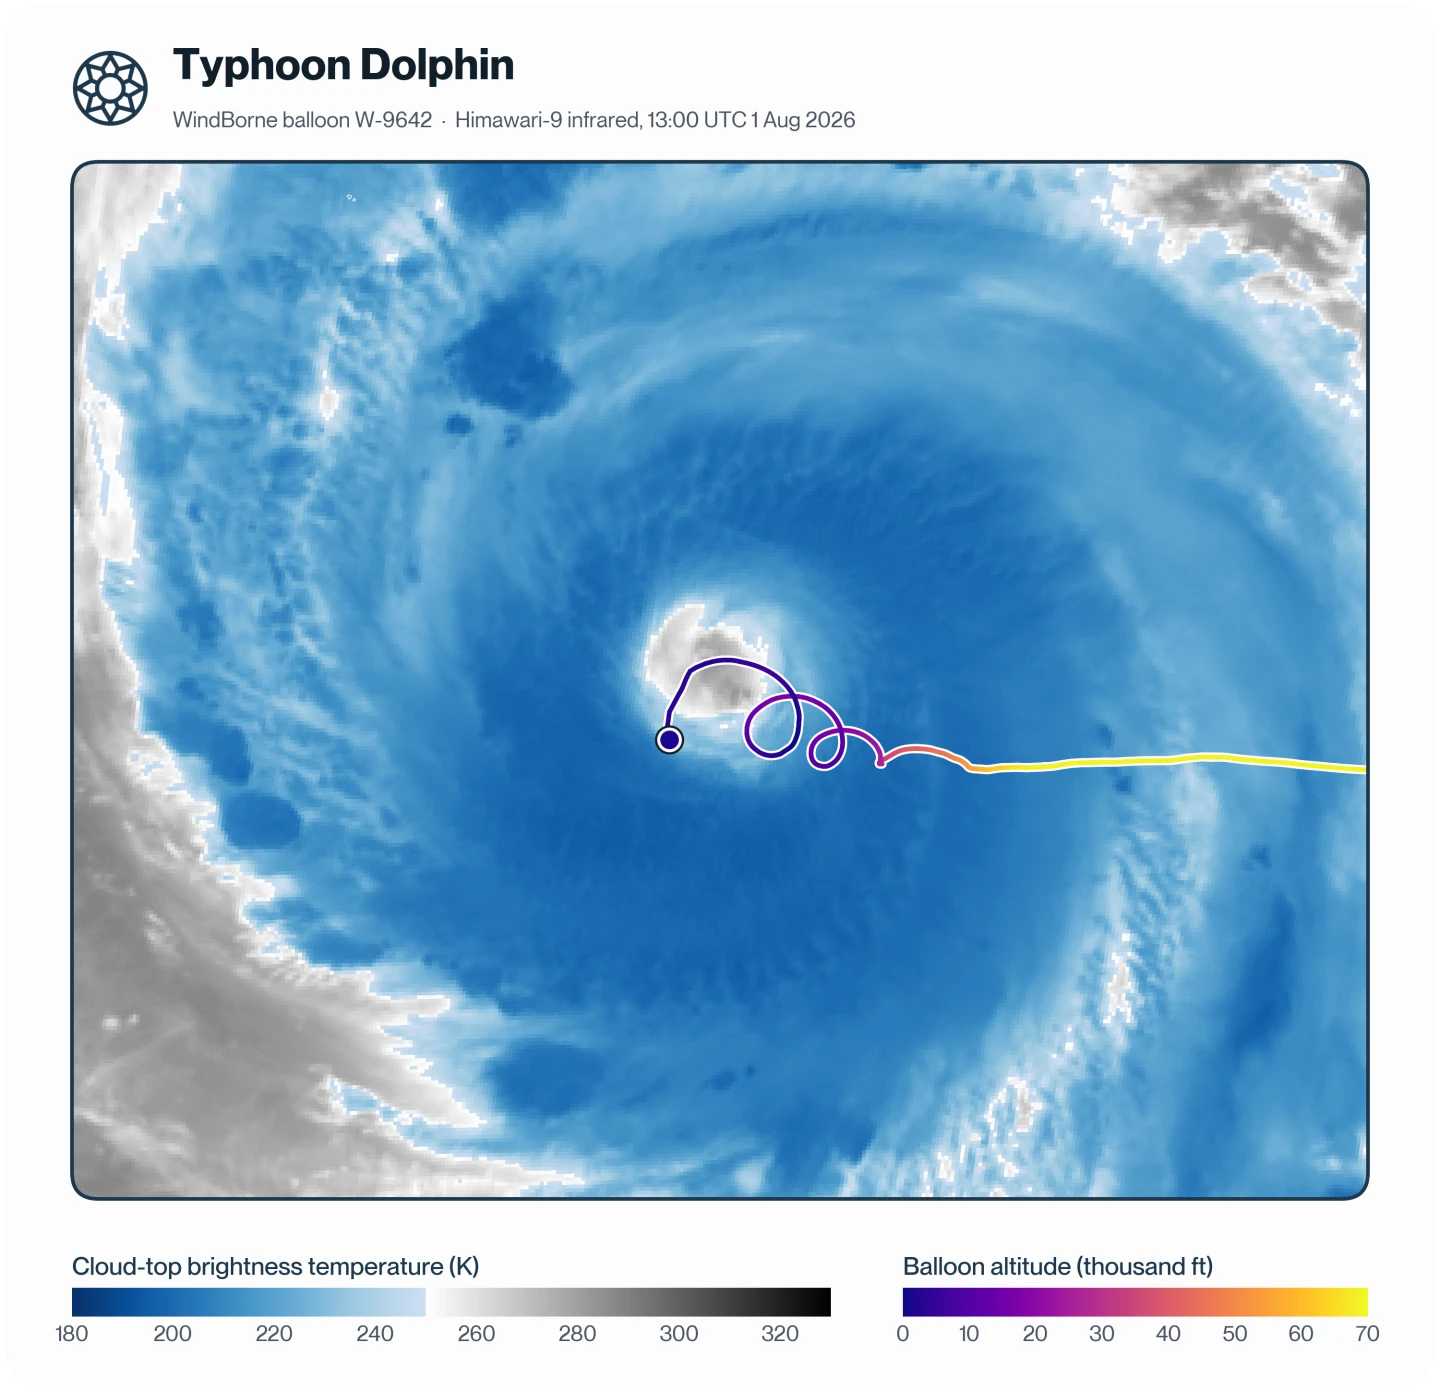
After a relatively quiet stretch in the tropics, Typhoon Dolphin became another Category 5-equivalent super typhoon in late July. By this point, we had two key findings from our Bavi intercept attempt. First, we could optimize our early The gap between a forecast's init time and its valid time, such as a 72-hour forecast. navigation by catching up with the storm from the east. We could take advantage of easterly stratospheric winds. Second, we could course-correct by descending into the upper troposphere, where the storm’s outflow layer and the vertical A change in wind speed or direction over a short distance, often with height (”vertical wind shear”). at its top boundary would push the balloon south or east. (Note: this approach works best if the balloon is too fast or too far north, but there are fewer effective recovery mechanisms if the balloon is too slow or too far south).
So we intentionally steered the balloon to arrive too fast and too far north relative to what a successful intercept required. That margin let us adjust course as needed and recover from small, unexpected deviations in the balloon’s trajectory.
Building in that margin only works if we can accurately predict where the balloon is headed, and this is where our existing tools fell short. Our existing method for estimating a balloon’s trajectory was based on A model that covers the entire planet. output, which typically has a ~0.25 degree horizontal grid spacing and 3-hourly time steps. While this resolution is adequate for many applications, it is challenging for precisely navigating into the eye of an intense tropical cyclone, for a few reasons:
The core is too small to resolve. The tropical cyclone’s inner core and eye are much smaller than a global model can resolve, so trajectories based on these models will not simulate the descent into the eye correctly.
The eye moves between time steps. As a tropical cyclone is moving, interpolating fixed grid points between 3 hours will incorrectly smooth over where the eye is located
To remedy this, we adapted our existing balloon trajectory model to use NOAA’s state-of-the-art HAFS hurricane model, and converted the grid to storm-centered coordinates to avoid the issue of fixed gridpoint temporal interpolation of a moving storm. This method allowed for much more pinpoint precision of exactly where and when to send the command to descend into the eye.
As we approached the storm, we kept the balloon above 19 km altitude to avoid deep The rising of warm air and sinking of cooler air around it, which builds clouds and drives thunderstorms.. Once over the eye, we let the balloon descend at a rate of 1-2.5 m/s, which led to the balloon circling several times around the eye. We estimate the lowest altitude the balloon attained was within 8 m above sea level, before it began ascending another kilometer. By its final circling around the eye, the balloon got tossed into the eyewall, where, not long before it stopped transmitting data, recorded peak winds of 135 kt supportive of a high-end category 4 intensity.
Typhoon Dolphin Data:
Estimated minimum MSLP in eye: ~924.5 hPa (estimated ~929.7 hPa MSLP with 56 kt wind when the balloon was at its the lowest altitude)
Maximum wind speed: 135 kt while climbing from 798 m to 977 m altitude (northern eyewall)
Lowest-level wind speed: 56 kt at 8 m altitude (southern end of the eye)
Typhoon Saudel: Our Third Attempt / Another Successful Eye Intercept
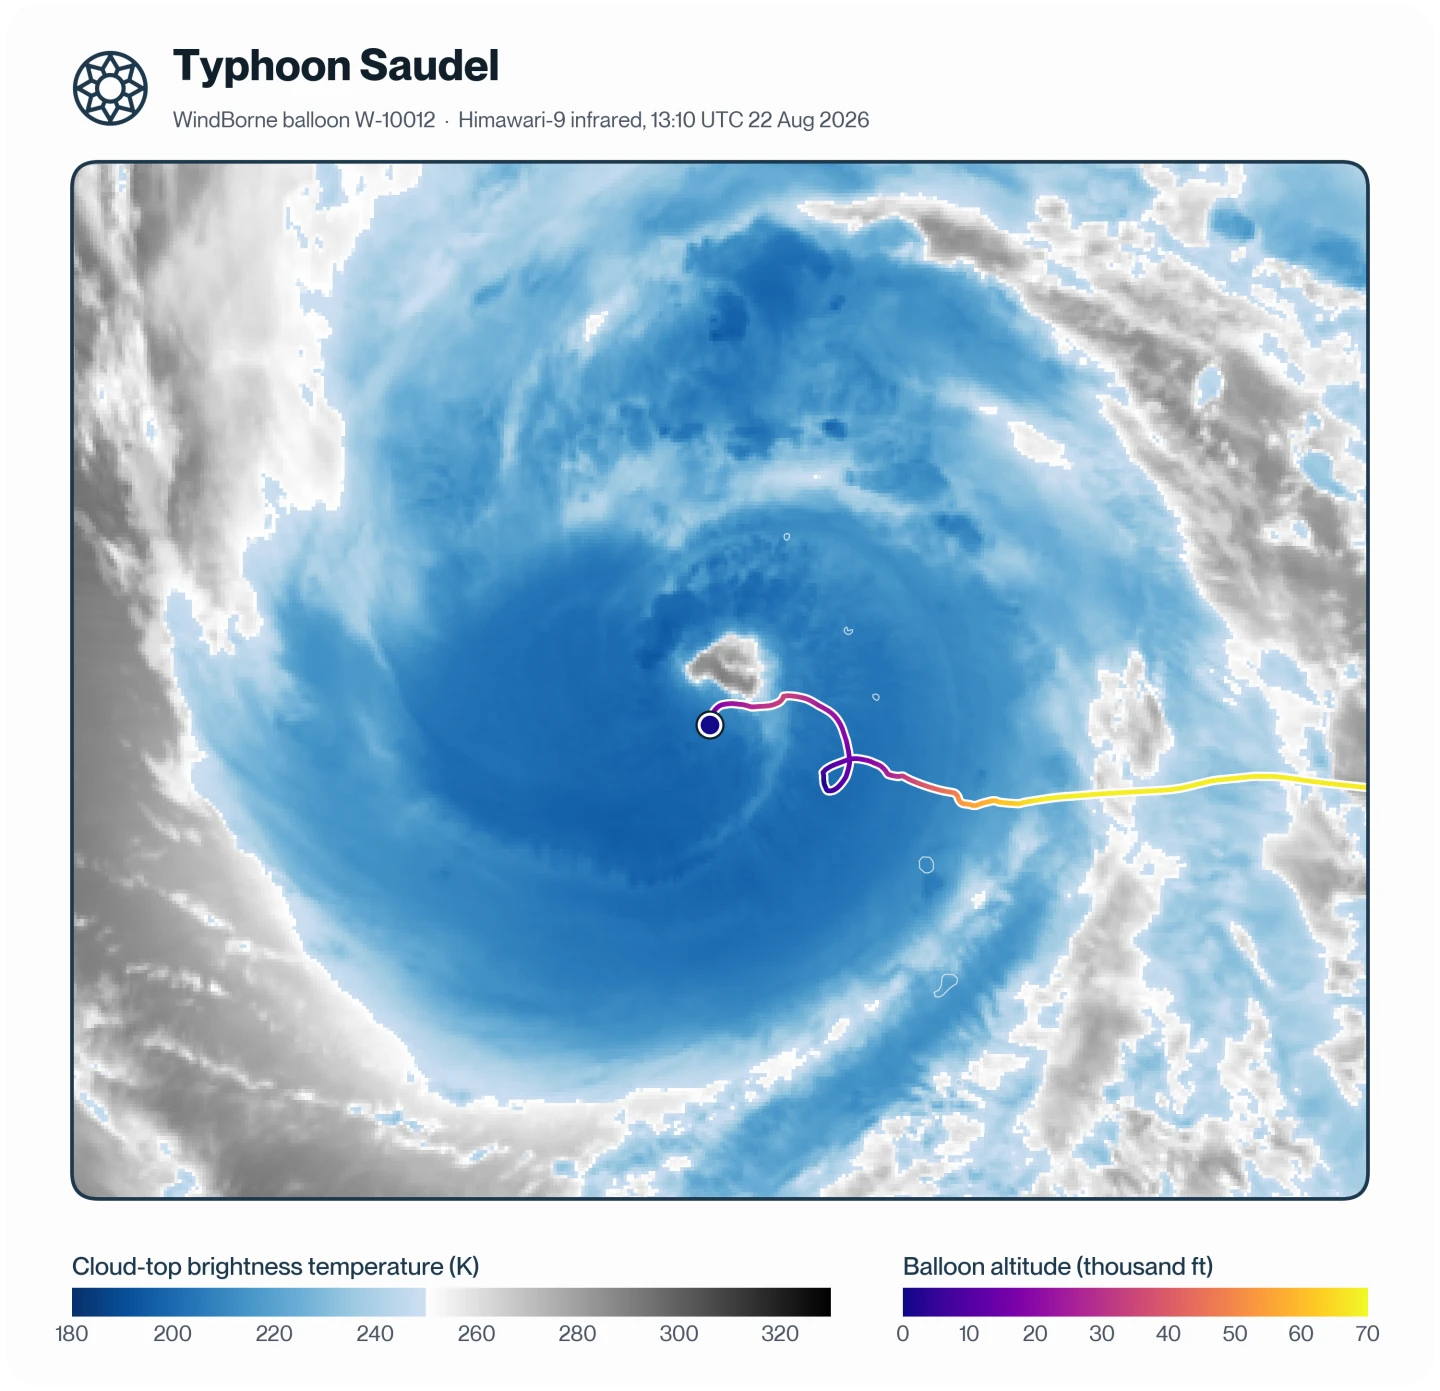
Following our successful eye intercept in Typhoon Dolphin, we attempted to repeat the same process for Typhoon Saudel. For Dolphin, we had navigated mostly through frequent manual analysis and less-than-perfect trajectory modeling. By Saudel, we had developed a method for objectively calculating the ideal trajectory, altitude, and descent rate to land in the eye. When using this method alongside continued manual analysis, we again successfully descended into the eye. This time, we kept the balloon entirely in the eye as we descended to 360 m above sea level, ascended back up to 10,933 m above sea level, before completing our final descent as the mission ended.
In Typhoon Saudel’s case, we intercepted the typhoon right as its eye cleared and it was undergoing rapid intensification. Using the estimated MSLP at each descent’s lowest point, and National Hurricane Center’s method for estimating a storm’s minimum MSLP based on a dropsonde’s MSLP and wind speed, we obtained the following estimates for its central minimum pressure and deepening rate during the mission:
Estimated minimum MSLP in first descent (0956 The global time standard used to label forecasts, so "00Z" means midnight UTC. 22 August): ~959.5 hPa
Estimated minimum MSLP in second descent (1312 UTC 22 August): ~956.0 hPa
Estimated storm deepening rate throughout mission: ~1.1 hPa/hr
Maximum wind speed: 54 kt at 7,268 m altitude (scraping the edge of the eyewall)
Lowest-level wind speed: 12 kt at 188 m altitude (located inside the eye)
Typhoon Bang-Lang: Invest-Stage Intercept
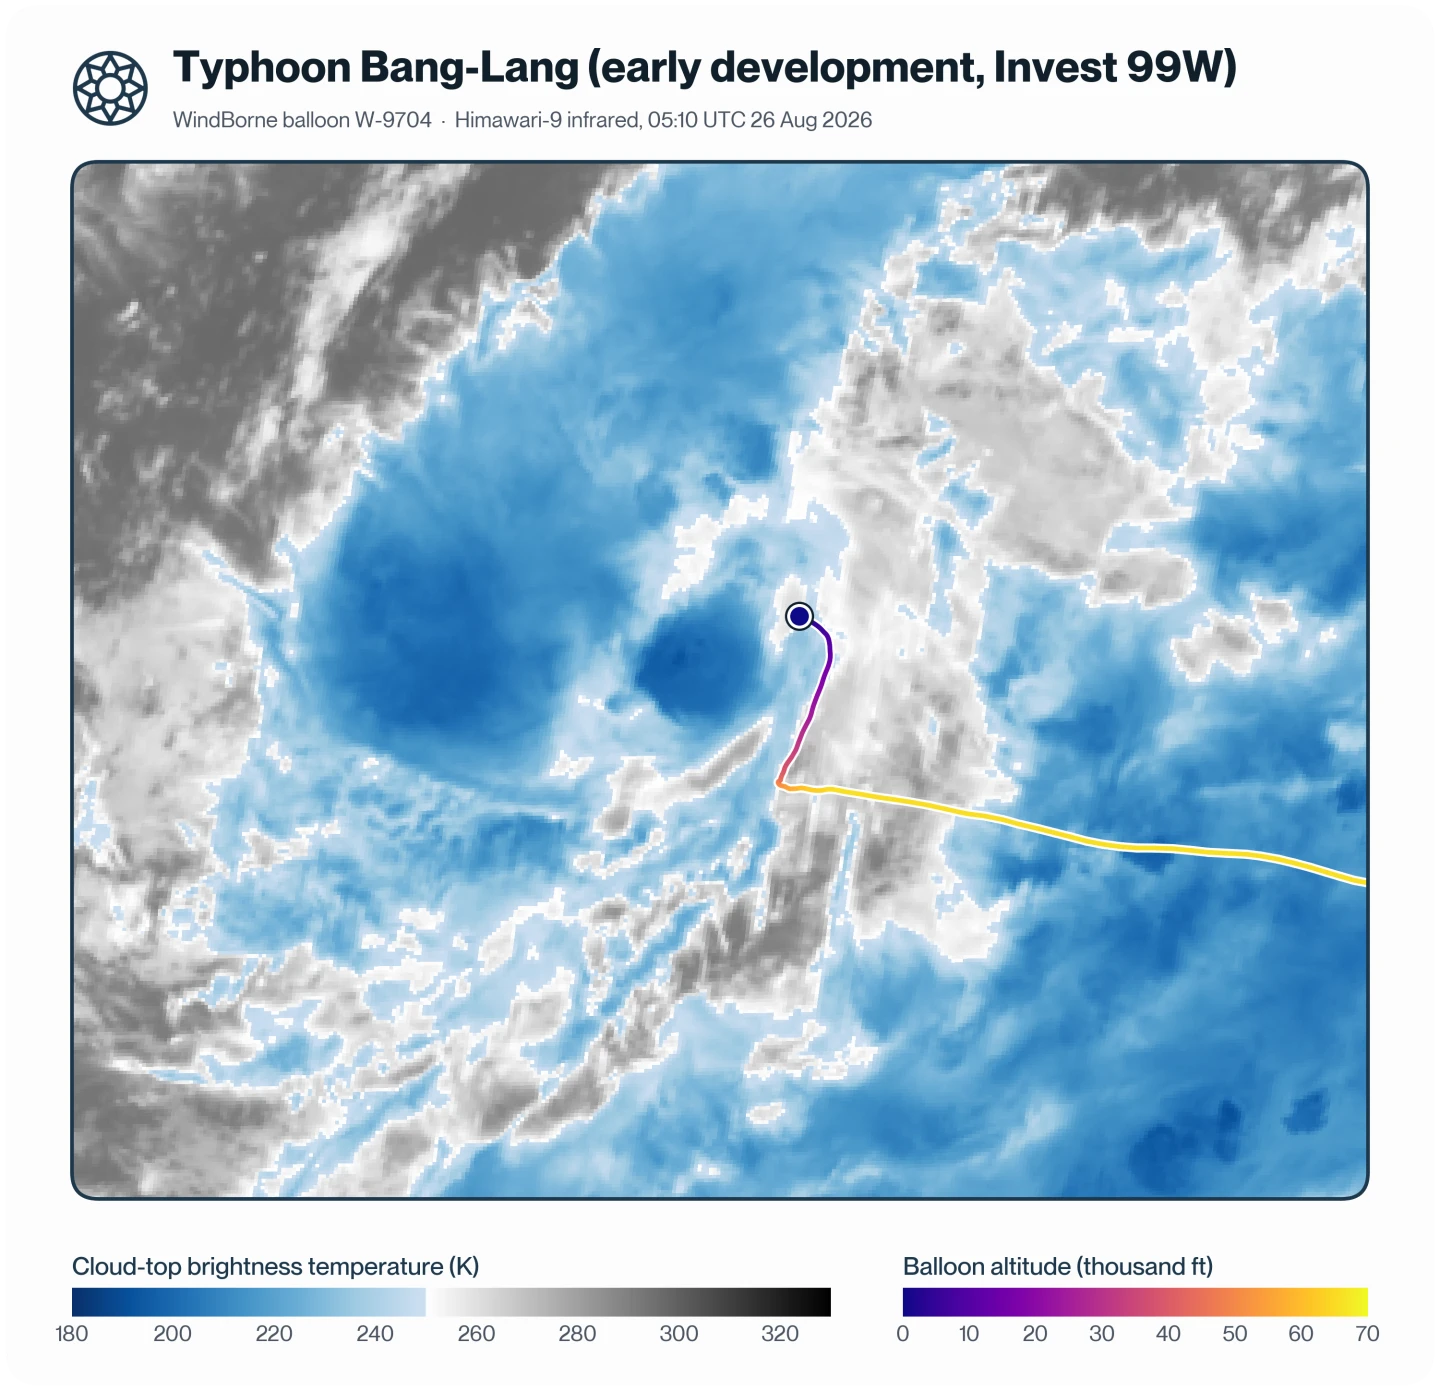
In terms of intensity, Typhoon Bang-Lang was a relatively unremarkable low-end typhoon in the open Pacific Ocean. However, it was notable for producing sustained deep organized convection early in its lifetime before it was designated as a tropical cyclone. The lack of in-situ data over this part of the ocean makes it difficult to estimate its low-level structure, and such compact, small systems have surprised us before – for example, Hurricane Oscar in 2024 was initially assessed to be a weak tropical storm until an aircraft reconnaissance mission found it was actually a hurricane. So, having a balloon in the vicinity of what would be Typhoon Bang-Lang, we attempted an intercept of its nascent low-level center.
Suspecting hurricane models were not adequately representing the structure of the storm, we relied on manual estimates to identify where the low-level center was likely situated in the lead-up to the descent.
Estimated minimum MSLP at landing: 1007.0 ± 2.9 hPa (estimated 60 km away from storm center)
Lowest-level wind speed: 18 kt at 32 m altitude
Typhoon Koguma: CDO Intercept
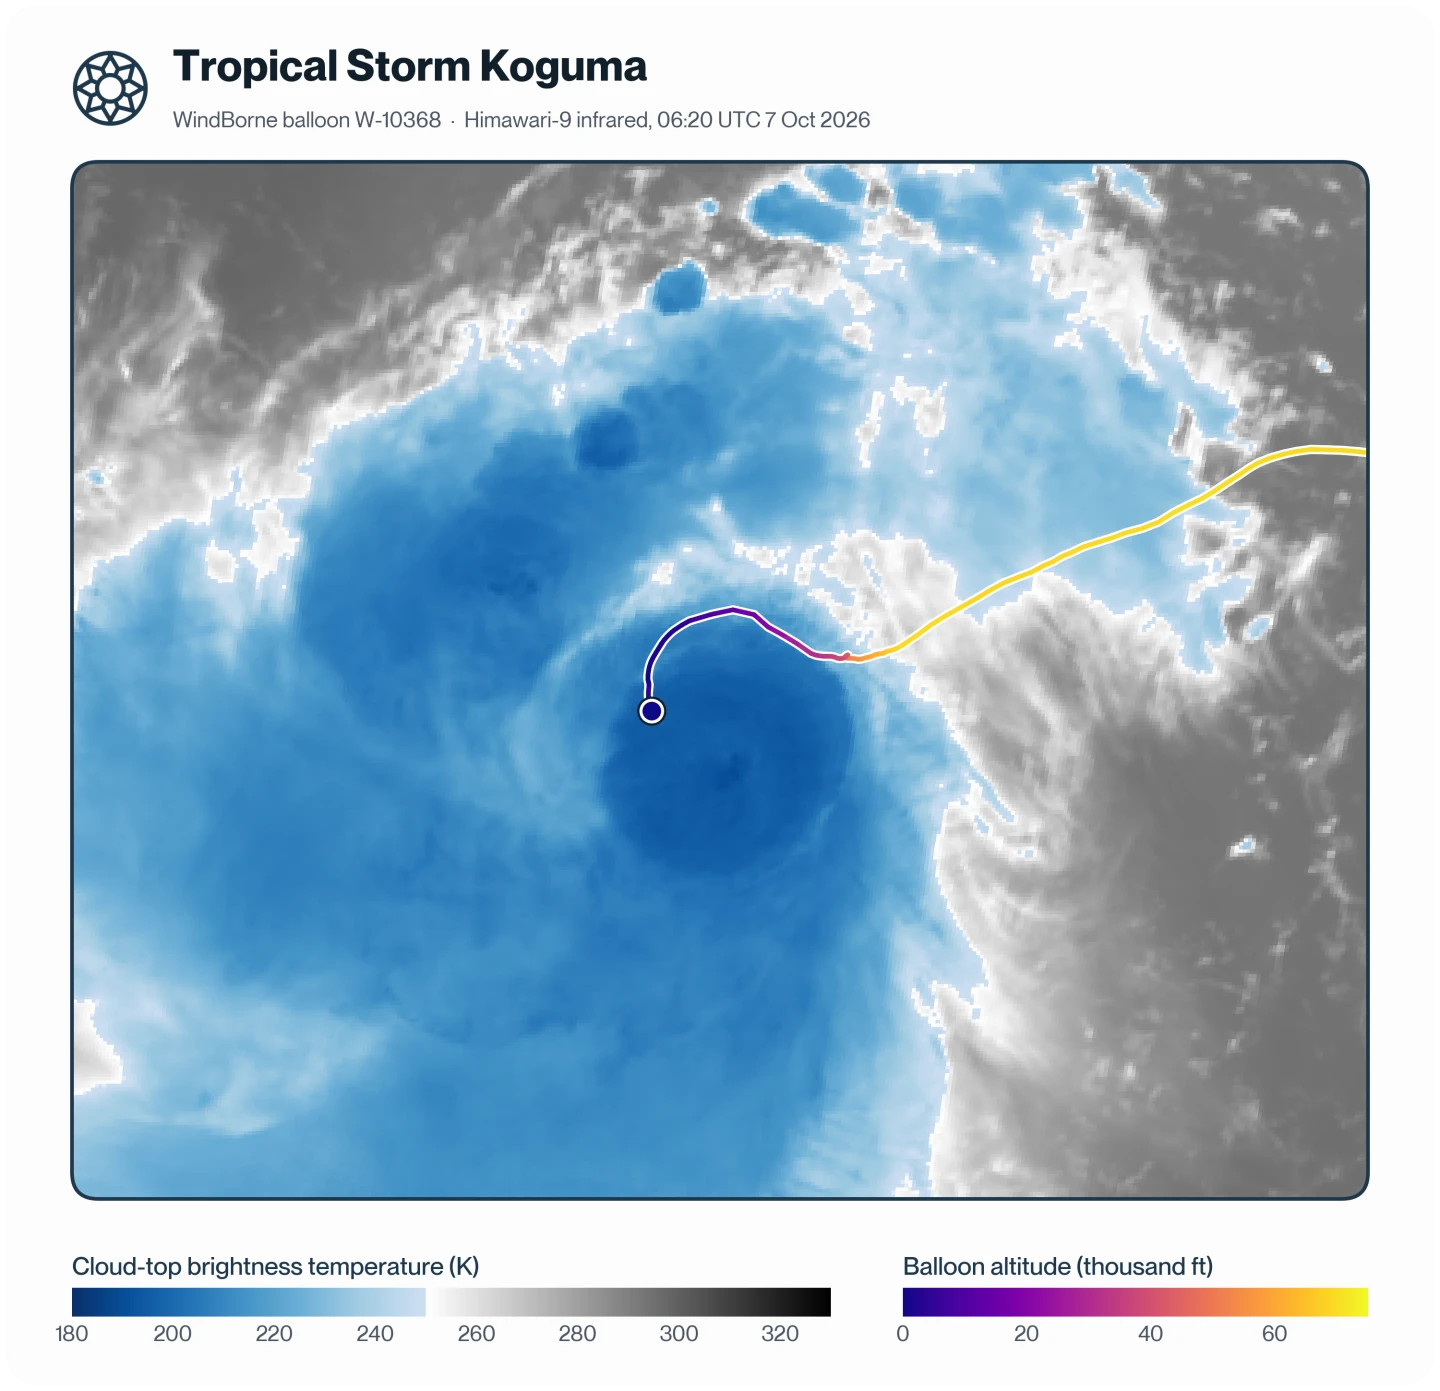
At the time of intercept, Koguma was a tropical storm experiencing moderate northeasterly vertical wind shear, meaning the deep convection and mid-level center were displaced southwest of the low-level center. Without a clearly identifiable eye, and with uncertainty regarding exactly where the low-level center was located, we relied partly on manual estimates to calculate the descent trajectory. As this was a relatively last-minute intercept attempt, we had little opportunity to optimize the trajectory to land at the exact center, and aimed for as close of an intercept to the center as possible. Our observations generally supported the low-level center being situated to the northeast of the mid-level center, but both were in slightly closer vertical alignment than the operational Joint Typhoon Warning Center assessment was.
Estimated minimum MSLP at landing (estimated 45 km away from storm center): 999.1 ± 2.9 hPa
Maximum wind speed: 49 kt at 1,290 m altitude
Lowest-level wind speed: 49 kt at 55 m altitude
Data Access
These are just the highlights of our tropical cyclone intercept missions (and we didn't even get around to discussing a few other missions that landed in the outer rainbands of these storms). Each of these missions has much more wind, temperature, humidity, pressure and altitude data, covering storms that otherwise lack A measurement taken directly inside the air being measured, rather than from a distance., including cases like an eyewall replacement cycle and a rapidly intensifying typhoon. We're making this data available for use - we'd love to see what the research and greater community finds!
For access, fill out this Google Form.
Note: any use of the data should attribute it to WindBorne.