Read the article
here.About the Author:
Howard is currently a Growth Product Lead, while finishing his coterminal MS at the Stanford Doerr School of Sustainability. Previously in summer, he was a Product Meteorologist Intern. He loves bridging meteorology and deep learning with client-facing strategies. Outside of work and school, he enjoys classical music and social dancing (but probably still spends way too much time looking at forecast models, satellite images, and radar loops).
Fun Fact: Howard has kept a weather diary for 13 years, was the youngest-ever member of the Canadian Meteorological & Oceanographic Society, and made sizable returns (5x) trading on the weather market. His latest research focuses on a physics benchmark for AI NWP models, which he will present at AMS 2026 this coming January.
Why Weather?
Weather affects everyone, anywhere, and at any time. Since childhood, I’ve been fascinated by the ever-changing weather and in awe of the human and economic loss from extreme weather.
On one hand, the weather is mesmerizing: waking up to the first snow blanketing the earth, catching a rainbow on the way home after a rainy day, or walking under the impressionistic fall foliage. Observing nature ignited my scientific curiosity: When will the first snow arrive this year? Why was the cherry blossom one week early? Where is the typhoon going?
On the other hand, the weather is terrifying: watching the TV news on more frequent and severe hurricanes, floods, and heatwaves worldwide was my introduction to climate change. I felt an urgency to unlock the mystery of weather and protect ourselves from its violent forces—studying the weather has a real impact.
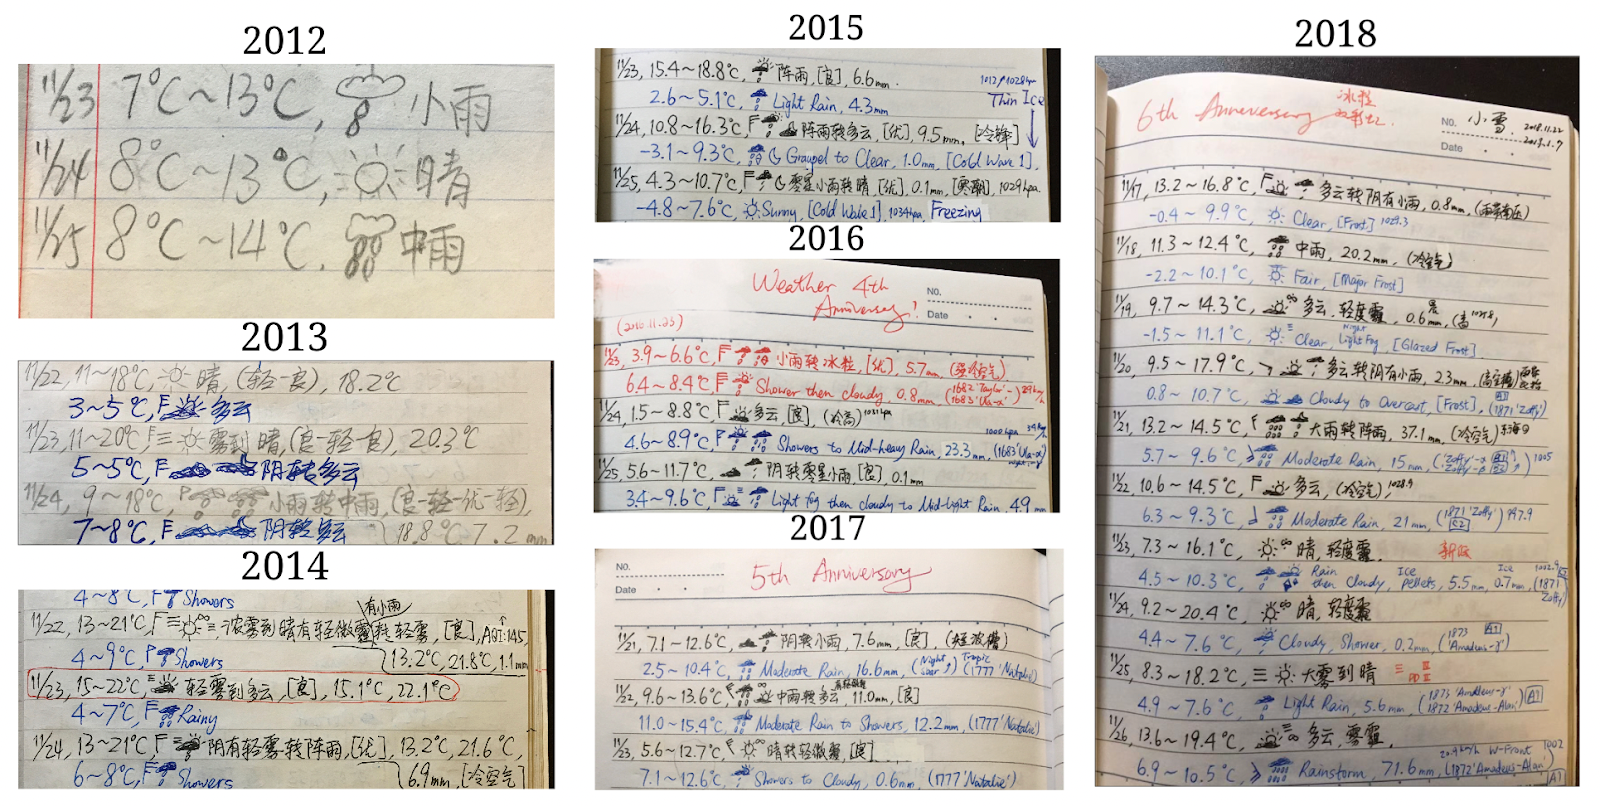
Thirteen years ago, in November 2012, three years before WindBorne became a student project under the Stanford Space Initiative, I started keeping my weather diary. That year, I was in 4th grade. I read about Chinese meteorologist Coching Chu, the father of East Asian meteorology, who kept a weather diary for 60 years. The article said that even on the last day of his life, his trembling hand held a pencil as he recorded measurements and analyzed. I was inspired by his dedication, and since then, I’ve been keeping my own weather diary, now thirteen years and counting.
On a piece of scrap paper, some naive pencil script was written: (2012) 11/23, 7~13ºC, Light Rain, 5.0mm. That was the first entry of the now almost 5,000 days of documentation. Over these thirteen years, the scrap paper turned into notebooks, excel sheets, and analysis charts; and mere weather documentation evolved into reading textbooks, studying numerical models, and research.

In high school, “weatherman” was my identity, and I became the youngest-ever member of the Canadian Meteorological & Oceanographic Society in 2017. To chase my scientist dream, I studied math and physics at Stanford to understand the natural laws that govern weather and climate (and the universe).
Course highlight 1: Atmospheric Dynamics
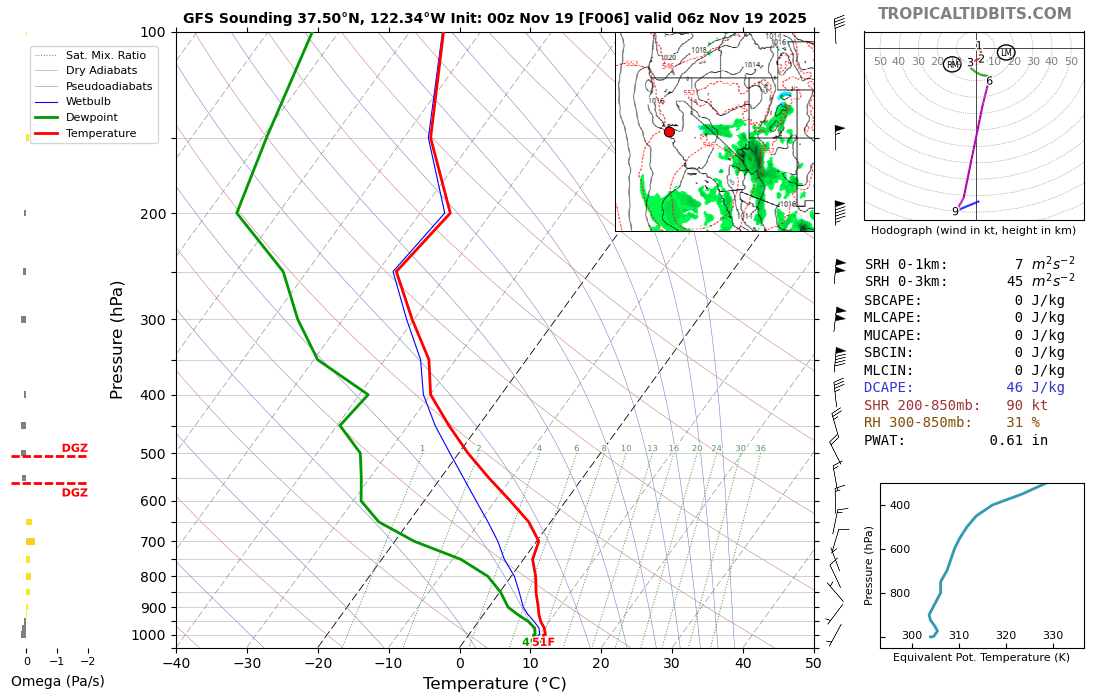
This quarter, I’m the teaching assistant for Stanford’s grad-level atmospheric dynamics class, which builds the Earth’s weather and climate system from ground up, starting with the planet’s energy balance to the physics of Earth’s general circulation. An important concept we discussed in class is this “sounding” which is a thermodynamics diagram showing the vertical profile of parameters—temperature, humidity, wind, etc. —at a location. This sounding is exactly what WindBorne’s balloons (and all weather balloons) collect, and it’s essential to weather forecasting. Looking at this sounding, by analyzing the temperature and dew point profile against the dry and moist adiabats, we can determine the stable and unstable layers in the atmosphere at this location, which entails the potential for convection (and hence storms).
Course highlight 2: Machine Learning for Physical Sciences
Furthermore, in another class I took last spring, Machine Learning for Physical Sciences, we emphasized the importance of training data quality. As WindBorne continues to scale Atlas, our global constellation, we are rapidly filling in the data gaps in atmospheric observation, which differentiates WeatherMesh, our AI weather model, from others.
What made you join WindBorne?
Weather is my passion, and it has long been my dream to build a career at the intersection of weather, climate, and tech, especially in the wake of climate actions. However, it’s not the easiest to find a company that combines weather nerds and your Silicon Valley tech-savviness. Well, not until I found WindBorne.
In late 2023, Google DeepMind published GraphCast, a purely AI-based weather model, which spearheaded the explosive growth in AI weather forecasting. I’ve never seen so much attention drawn to meteorology. As I was learning about all these AI weather models, I found WindBorne’s WeatherMesh, which outperformed GraphCast and took the crown. Naturally, I became a little skeptical but mostly curious about how this startup was able to beat Google.
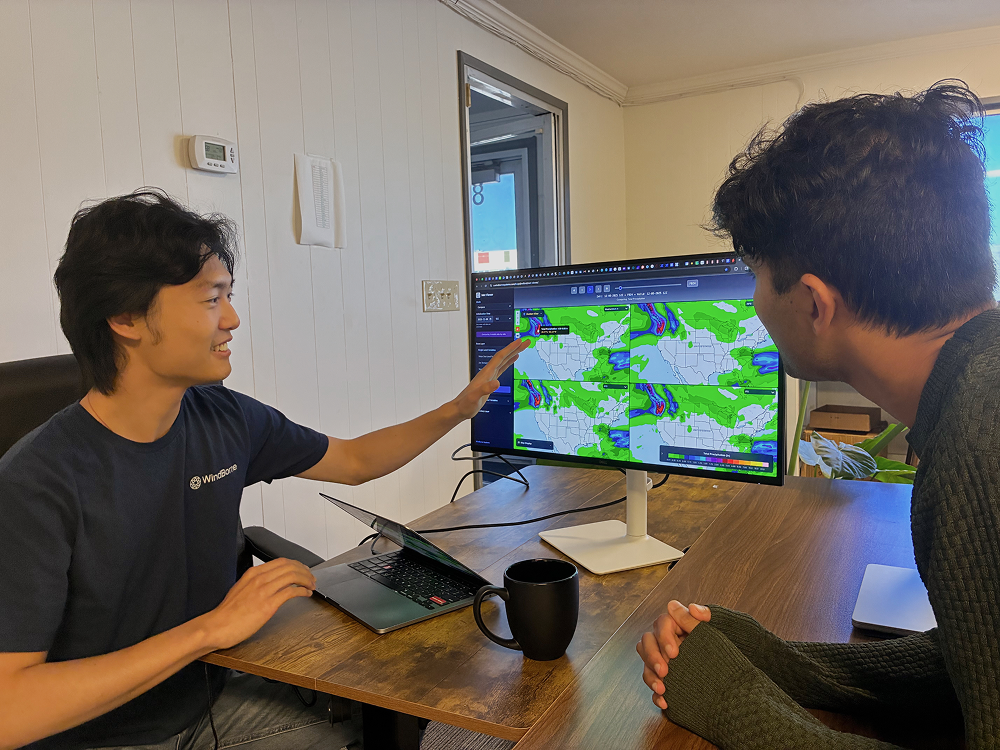
Earlier this year, my friend Lyna Kim, then Head of Commercial Growth at WindBorne, gave me an office tour, and I was quickly convinced: The on-site factory where physical weather balloons are designed and manufactured, the dashboard showing the real-time location and status of hundreds of balloons aloft, and a wall of monitors presenting livestreaming footage from WindBorne’s launch sites worldwide. This is not one of your typical “AI B2B SaaS” startups: WindBorne has physical assets collecting proprietary data, which yields a differentiating AI model.
I joined in June as a Product Meteorologist Intern. As new AI weather models are being iterated and weather is becoming more volatile from climate change, I’m thrilled to be in this much-beloved and rapidly growing sector: not just operationalizing AI weather models, but also leveraging meteorological data to better understand life and business impacts: commodities trading, power outages, renewable generation, and disaster preparation.
Reflections on our culture
What I love about interning at WindBorne is its culture: a strong sense of community and the freedom to explore.
Everyone at the company, doesn’t matter what you do—hardware, software, or business—has to do the ValBal Journey as part of onboarding. The ValBal Journey is one of the company’s onboarding requirements (read more about our Head of Communications experience here) where each new employee is tasked with shadowing tenured team members and engaging with the four operational components of WindBorne: manufacturing, launch, navigation, and post-flight analysis. This crash course on the inner workings of our tech allowed me to get hands-on - when you deal with the hardware, you feel the “realness” of everything we are building.
WindBorne also values agency. Once our CEO John Dean asked me, “Are you having fun at work? If whatever you are doing doesn’t excite you, you should let us know.”
During my internship, I was tasked with consolidating a case study library for extreme weather events impacting our existing and potential customers. These cases evaluate our model’s performance and demonstrate how WindBorne can bring them value. Sometimes it can feel like a “whodunit” process, where I go back in time and reconstruct the timeline of an evolving storm.
In July, I achieved the most significant growth in designing an early-warning product for a major U.S. utility, where I translated raw weather model outputs into actionable alerts and visualizations to help reduce outages during severe weather events. It challenged me to bridge scientific rigor with customer needs. Building on that, this fall I worked on a power outage analysis, laying out the geographical and seasonal distribution of weather-related outages.
Okay but the best part? The side-quests. WindBorne is full of (constructive) side-quests: During the summer, I monitored the tropical oceans with the meteorology team and flight ops. We devised plans to drop our balloons into an active hurricane to collect data. Hurricanes are one of the most violent and costly weather events on Earth, yet accurately forecasting their intensity and track remains a challenging task. Thus, it’s essential to collect in-situ data within hurricanes so that we may better research them, and navigating a balloon into the eye while avoiding all the messy weather and outflows is a precision exercise.
Candidly, I’ve always dreamed of staying up all night, being in a situation room and gluing my eyes to a mosaic of monitors showing satellite, radar, and reconnaissance data, making real-time analysis as a hurricane develops. And it is all that I imagined it would be. I was never lonely during the process, as I would often find my cracked Canadian buddies Anish and John Liu passionately coding at ungodly hours. A bowl of ramen, a nap on the Jouch (our napping couch), and we were locked in again.
Can’t wait to continue to sidequest!


