Visual blog | October 16, 2026
Snapshots through weather forecasting history
At some point, we realized that the weather is not entirely unpredictable. We noticed patterns. Patterns demanded explanation. Explanation led to building a whole system of satellites and balloons, very useful ideas for how the atmosphere works, a lot of compute power, and international coordination. Now we’ve added roughly a day of useful forecast for every decade of work in the last forty-some years, stretching reliable predictions from a day or two out to around ten. How? We go back in time to see how certain pieces of knowledge, technology, and changes in perspective unlocked one another in this long-lived endeavor.
So, you want to see the future?
Here is the flowering bush, the Greek treatise, the Morse code, the checkerboard, the punchcards, the balloon. Go on this journey on how humanity watched for patterns and learned how to predict the weather. May the wind be ever at your back.
1
Vegetal forecasters
Insights from watching a weather-inclined shrub
I was visiting home in Los Angeles when I walked into a shrub sparkling with superb purple blossoms. I gave it a scan with my phone, which came up with an unexpected name: barometer bush.
What’s a plant got to do with pressure?
The normally unassuming, dry, silvery-leafed plant goes by more than a few names, among them cenizo, Texas sage (though it is not a true sage), and wild lilac. Once in a while, the bush bursts into short tube-like flowers lined with speckles on one side. Folklore has it that the flowering barometer bush is a sign of coming rain. It’s true that rain is often accompanied by lower pressure. But digging around some more, I found that some horticulturalists say it can flower both before and after a good rain. They say it’s likely triggered by high humidity or damp soil, suggesting that the bush is not literally responding to changes in air pressure.
Not that all weather prediction before modern forecasting was superstition. From early to modern times, humans have been very good at recognizing patterns. Many old weather signs do point to something physical. The more common “Red sky at night, sailor’s delight” works because mid-latitude weather tends to move west to east, so a red sunset means clear skies in the direction tomorrow’s weather is coming from.
Even if, by themselves, these signs and associations can tell you little of the why, the what usually has to come first. The big steps in understanding weather would usually begin the same way, with someone paying close attention to their world.
2
Sublunary exhalations
Aristotle’s vision of the weather and knowledge
Aristotle’s Meteorologica, the oldest comprehensive treatise on weather, drew a circle around everything from clouds, rain, wind, and thunder to comets and the Milky Way, and established its study as a field. If you were to attend a lecture in this curious new “study of things high up” sometime after around 350 BCE, your mental image would probably look something like this:
Beyond the moon, in the superlunary, the heavens are perfect and unchanging. Below it in the sublunary, everything is made of four elements, earth, water, air, and fire. The sun’s heat draws two exhalations from the earth. A moist one rises from water and returns as rain, snow, and dew. A dry, smoky one rises from land, drives the winds, bursts out of clouds as thunder, and ignites as lightning and comets. Comets must belong to the air, since nothing new could appear in the heavens.
Meteorology had yet to be the field we’d recognize now. The meteorology of antiquity was not very troubled by instruments, or records kept over time, or really forecasting at all. Weather was taken to be “disorderly,” or unpredictable, in contrast to the movement of the stars in the sky. At the time, truth and knowledge typically meant being able to reason from first principles to arrive at a conclusion, like in geometry. Observation was a bit more second fiddle.
Meteorologica took on the status of the leading theory of weather phenomena for the next two thousand years. During this time, scholars practiced meteorology almost exclusively through reading, commentary, and debate. As mathematician and atmospheric science historian Howard Frisinger put it, whenever the choice arose between going out to nature or back to the books, the scholar chose the books. Was this too much deference to tradition?
In any case, one can only get so close to truth this way if the premise is flawed. For a while, farmers and sailors relied on signs and astrology to anticipate the weather (does the ox lick its hoof?). The Meteorologica’s long reign shows what knowledge looks like when an elegant, if fantastical, theory is asserted without being tested.
A highly simplified summary of how science philosophy changed
Only later would a revolution in science establish the central role of the hypothesis, to be tested against evidence such as measurements from the thermometer and barometer. It would turn out to be a useful way of knowing.
3
Dots, dashes, and weather maps
Connecting far-flung weather observations
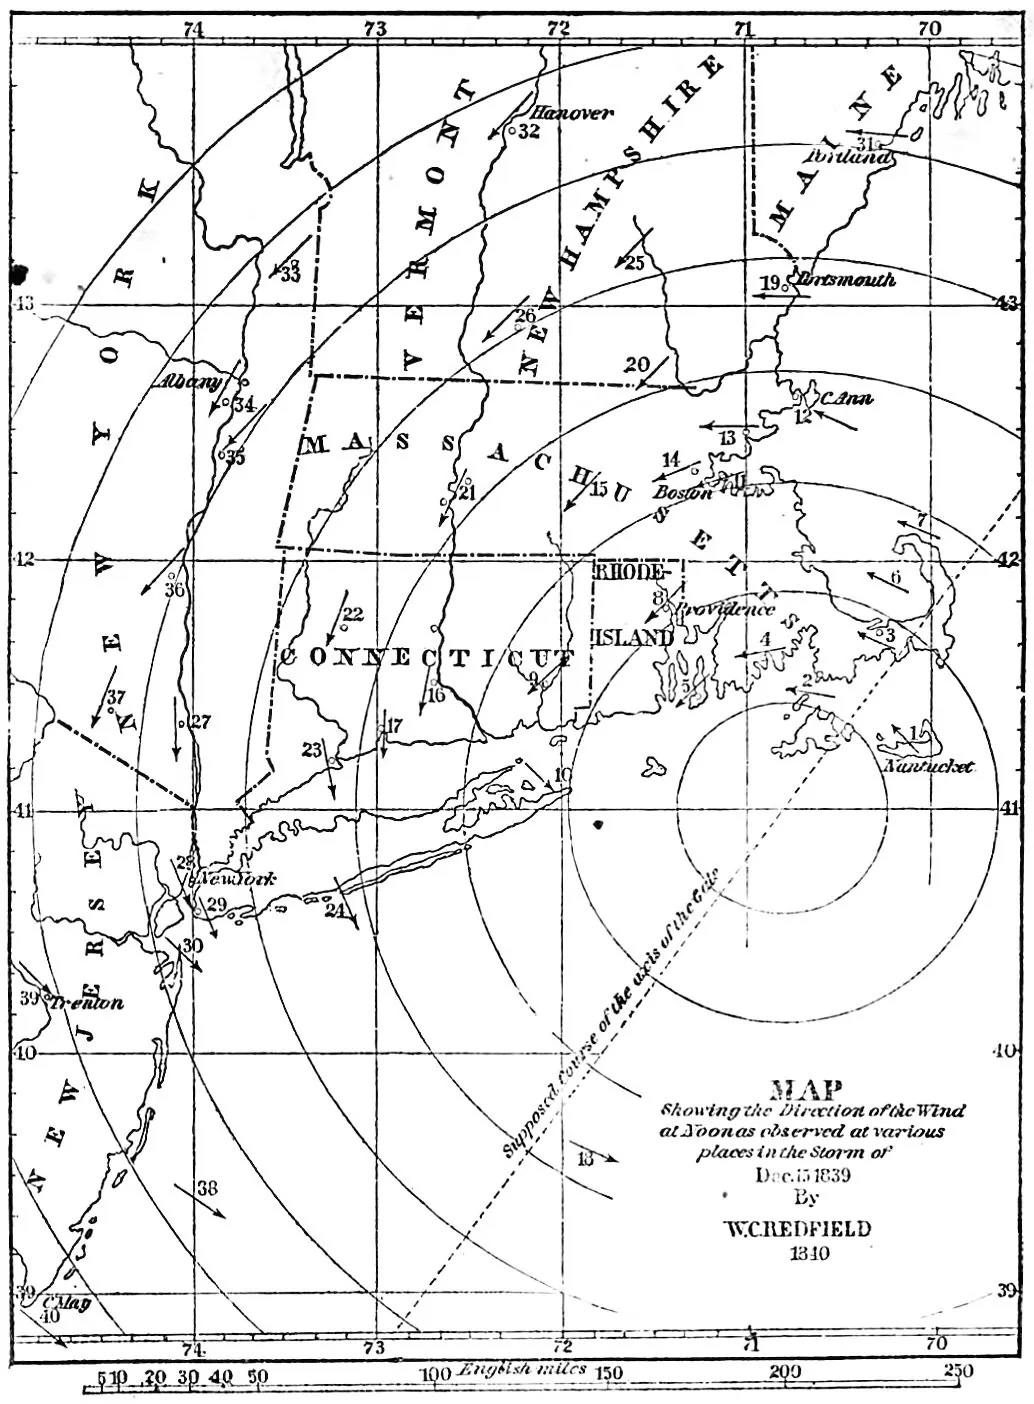
A merchant by the name of William Redfield entered meteorology more formally after a hurricane hit the northeast in September of 1821. While traveling, he noticed that trees had fallen toward the northwest in Connecticut, but toward the southeast in Massachusetts.
These, along with other observations, were published in a journal ten years later with a dramatic conclusion, italics from the original text:
and how were all of the most violent portions of these atmospheric movements which occurred at the same point of time, confined within a circuit whose diameter does not appear to have greatly exceeded one hundred miles?
To the writer there appears but one satisfactory explication of these phenomena. This storm was exhibited in the form of a great whirlwind.
Based on treefall and direct wind observations, Redfield described hurricanes as depressions in surface pressure, with gales blowing counterclockwise in concentric circles.
Not everyone agreed. A classics scholar named James Espy took him on in a public dispute sometimes called the “American Storm Controversy.” Espy believed that heating at the center of the hurricane produced the low pressure, and that the low pressure drew wind directly inward.
Neither had the full picture.1
Redfield’s map of the storm of December 15, 1839, assembled from many dozens of local reports.
From W. C. Redfield, “Observations on the storm of December 15, 1839” (1843).
Underlying mechanisms aside, you may wonder how such fundamental disagreement over the wind structure was even possible—just plot a map! While this would indeed settle the question, maps were tedious to construct at the time. Take Redfield’s map of an 1839 storm, pictured here, assembled from many dozens of local reports. That artisanal approach works for studying a storm in retrospect, but not so well for forecasting one. What you needed was instrumentation, everywhere, in real time.
The barometer had been invented almost two centuries before the storm controversy, credited to Evangelista Torricelli in 1643. By the 1700s, barometers hung in many well-to-do homes, with their dials printed with Stormy for low pressure and Fair for high pressure. But a barometer only reports the air directly overhead, and a falling needle only says a storm is on its way. If you wanted to know what kind of storm, how severe it might be, and when it would hit, you’d want many observations made at the same moment and gathered together faster than the storm can travel. In the age of horse and sail, storms moved faster than news.
The telegraph changed that. By the 1850s, wires ran alongside railroads across much of the country, and information could finally outrun the weather. Telegraph operators wired in their morning conditions to the Smithsonian, and a large map of the US in the Smithsonian building displayed colored chips representing individual measurements of the day’s weather across the country. In 1861, the British public was introduced to something called weather forecasts.
- New York, 7 a.m. Barometer 29.86, falling. Wind northeast, fresh. Cloudy.
- Philadelphia, 7 a.m. Barometer 29.91. Wind east, light. Rain.
- Boston, 7 a.m. Barometer 30.02, steady. Wind north. Clear and cold.
The fact that observations of the weather were made was not anything new; what shifted was the perspective they collectively gave. A single observer may ask, what is the weather here? A map, meanwhile, takes scattered readings and renders them into coherent systems: a center of low pressure with winds wheeling around it, moving in predictable directions at predictable speeds. Weather, as an experience, went from being a practically random condition to large-scale patterns that could be seen ahead of time. Observations from volunteers flooded in over the wire, and with this the doors were open to a new field, synoptic meteorology.
Synoptic: Greek for seeing together.
4
The forecast factory
A remarkable prediction, less of weather and more of how we make forecasts now
Looking at a weather map can only tell you so much about the next few days. It probably only tells you a bit about tomorrow. Beyond that, who knows if that low pressure system is going to strengthen or not, or how the winds moving it towards you are going to change.
What might be useful, thought some, was thinking about the atmosphere as something that followed physical laws. Equations describing atmospheric motion had come a long way since the first weather maps. Earth’s rotation had been worked in, explaining why winds spiral around storms instead of blowing straight into them. Thermodynamics too, showing that rising air cools as it expands and that condensing water vapor releases heat. By the turn of the century, these pieces fit together into a complete system: seven variables, including pressure, temperature, density, moisture, and wind in three directions, linked by seven equations.
In principle, forecasting was now a matter of measuring the atmosphere’s starting state and stepping the equations forward in time. In practice, integrating those equations to make useful forecasts was deemed impossible by the same people that articulated the idea. So impossible, that the proposition to do just that by Lewis Fry Richardson was largely dismissed.
In his book Weather Prediction by Numerical Process, Richardson imagined a forecast factory. He wrote,
After so much hard reasoning, may one play with a fantasy? Imagine a large hall like a theatre… The walls of this chamber are painted to form a map of the globe.
He estimated that 64,000 people, carrying out calculations on paper in synchrony, could keep pace with the weather (in reality it would still require many, many more). Each person doing calculations, then called a computer, would work on the weather of their own patch of map, and pass their results to others whose calculations relied on them.
Decades later, the artist Stephen Conlin painted Richardson’s fantasy: a vast spherical hall, its walls painted with a map of the world and lined with tiers of people calculating at their desks. You can see it on his website.
To show the method worked, at least on a smaller scale, Richardson needed a worked example. The goal: forecast weather over a single six-hour step at two points over central Europe. This he computed by hand, part time, taking about two years.
The disappointment he must have felt! The forecast that didn’t even look like real weather. Surface pressure near Munich changing by 145 hPa in six hours was a hundred times anything realistic. He published the negative result anyway, in full, and it ended up serving as a sort of conceptual blueprint for later numerical forecasting.
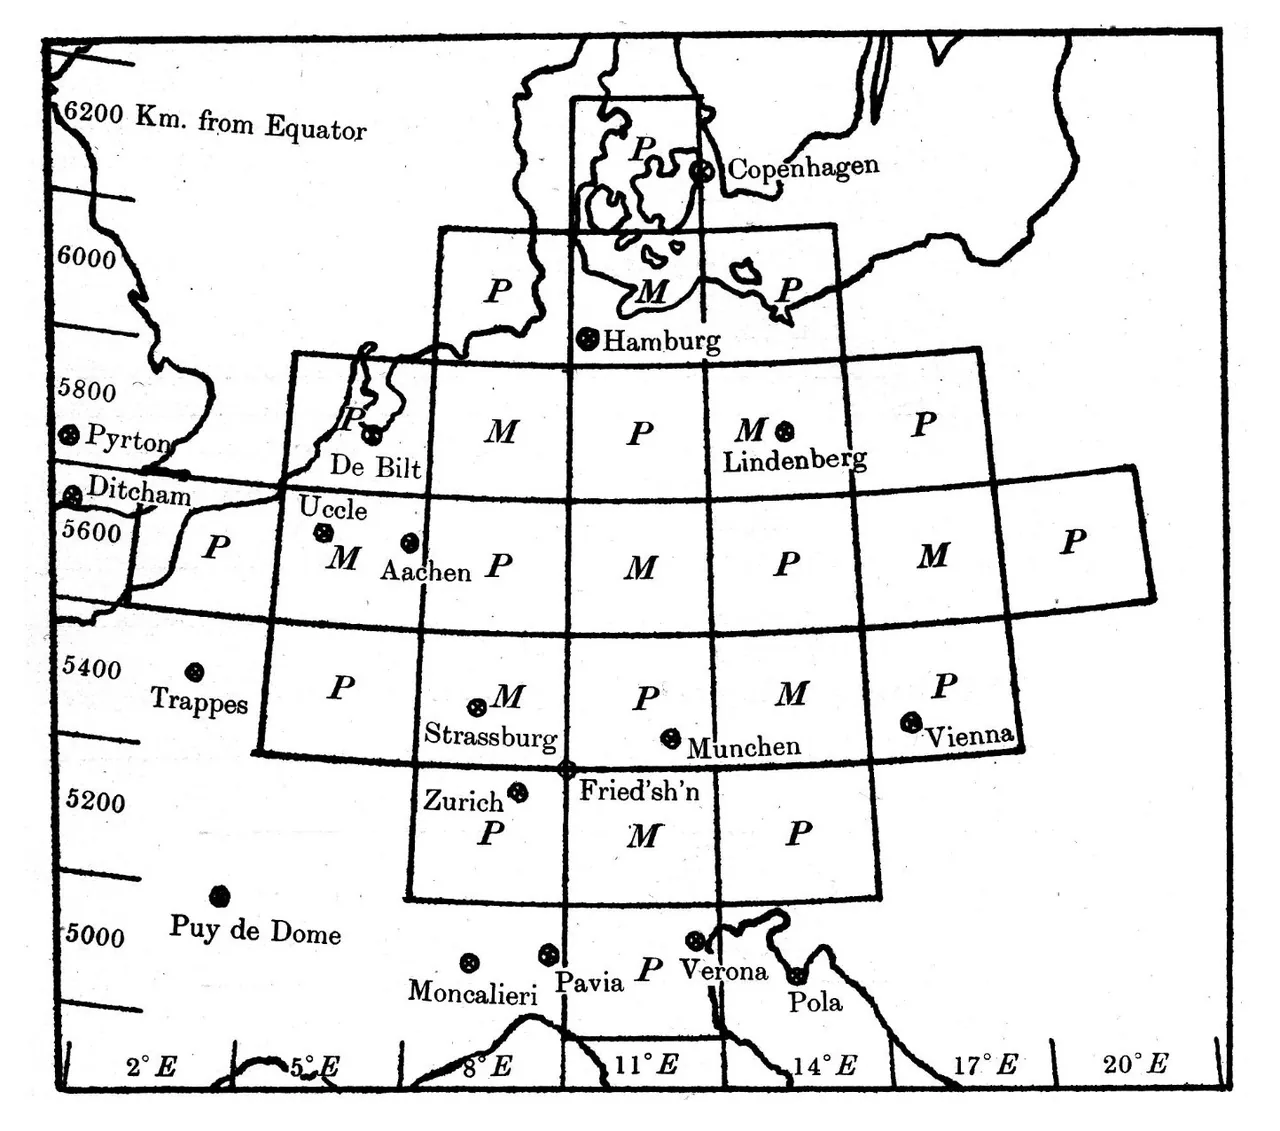
Much later, a retrospective computer analysis found the causes. It wasn’t that the arithmetic was bungled, which is remarkable considering he did calculations between working with the Friends’ Ambulance Unit in France during World War I, and at one point lost the whole manuscript only for it to turn up under a heap of coal. It was, in part, errors in the observed winds that led to large, spurious oscillations in pressure.
It took decades for the missing pieces to arrive: better observations of the upper air, theory to tame the atmosphere’s fastest waves, and, above all, a new kind of machine to perform the calculations. The dream, as Richardson had put it in 1922, was that someday it would be possible to “advance the computations faster than the weather advances.”
In 1950, a paper arrived in the mail describing the first weather forecasts made by a computer. An electronic one, this time, rather than the human computers he had written about previously. The forecasts looked about like the weather that actually happened, and he sent his congratulations. Richardson lived just long enough to see the dream starting to come true before he passed away in 1953.
5
D-Day to computers
The step change in weather forecasting
On the night of June 4, 1944, Allied troops were already loading onto ships in the English Channel. Conditions had to be just right to land on the shores of Normandy in occupied France, with a near-full moon, and neither low nor high tides. Since the weather was still good, the invasion was planned for June 5. But in the last few days, every four hours, meteorology teams had been plotting surface weather observations on a map, tracing by hand a low pressure system moving across the Atlantic. The high winds and clouds would foul their narrow window.
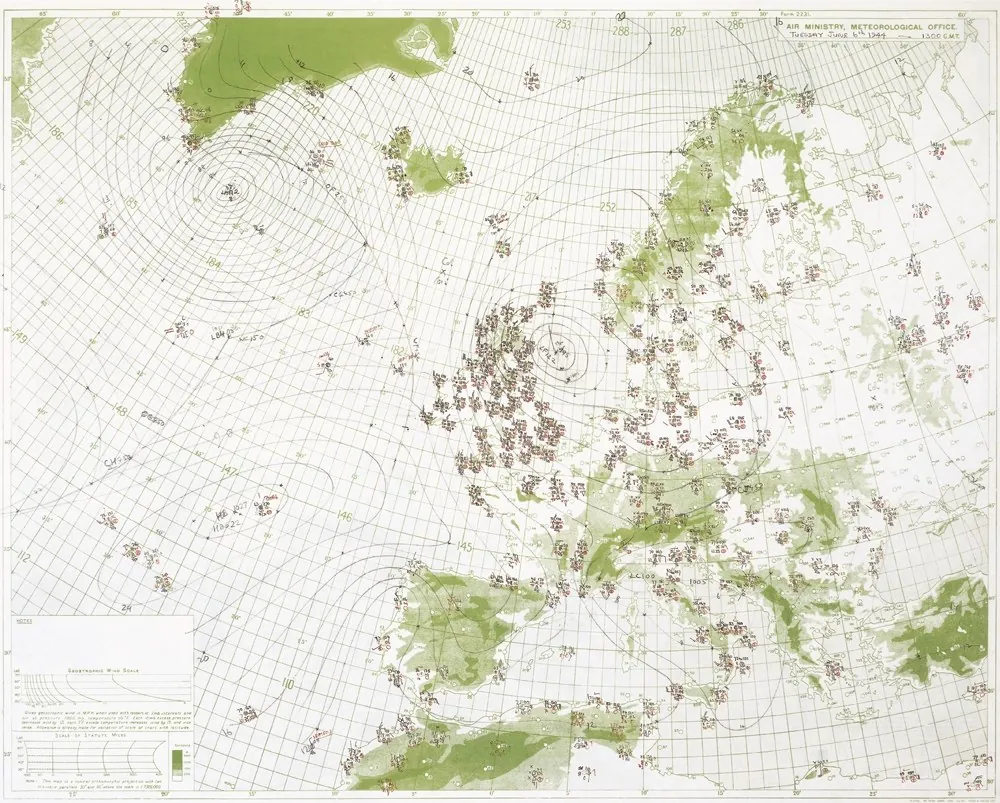
Little had changed in the way of practical forecasting, even after almost a century of weather maps. The American team relied on analogue forecasting, matching current surface pressure patterns against a 40-year historical archive, and predicted clear weather for June 5. Meanwhile, the British team used the emerging Bergen School method, tracking the atmosphere as a fluid physics problem. They predicted that June 5 would be catastrophic, and June 6 would be better. A great effort was needed to convince leaders to delay their plans (you can imagine there was quite the clash between forecasting teams). The 6th turned out to be the right choice. Not seeing this gap in storms, the other side was relatively unprepared, and the rest is history.
That was about the end of analogue forecasting, and the beginning of yet a new age. Within two years, the U.S. Weather Bureau, the Navy, and the Air Force were jointly funding an unproven and expensive idea: picking up where Richardson left off, this time with a machine. An international team led by von Neumann, Charney, and others used a simplified version of the full equations of motion, and filtered out fast oscillations to keep only the slow, large-scale swirls that shape the weather a few days out.2
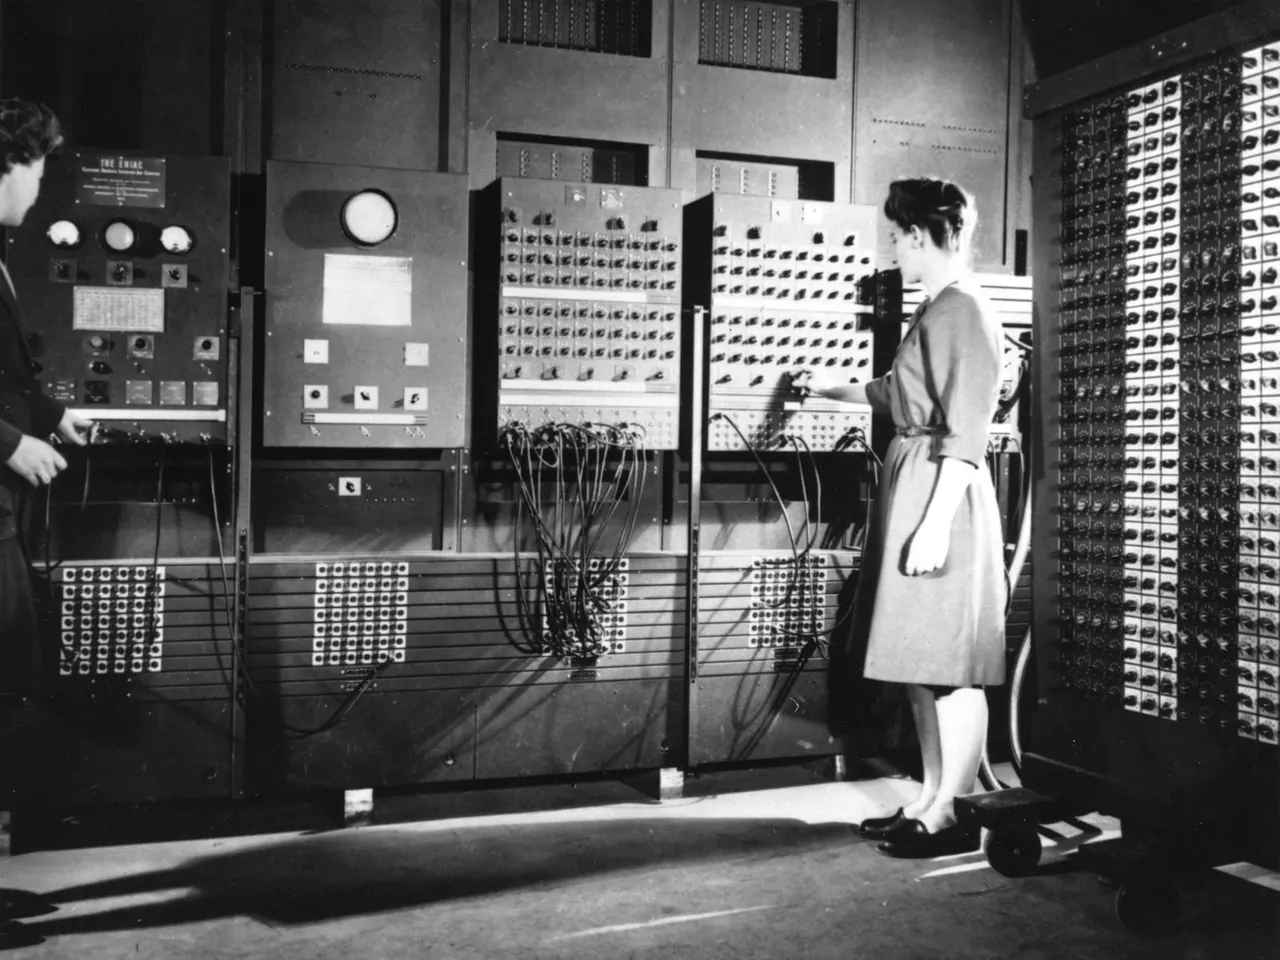
The computer they used was ENIAC, short for Electronic Numerical Integrator and Computer, and nicknamed “Giant Brain” by the press, weighing almost 30 tons, filling a room, and needing thousands of punchcards to serve as external memory for storing the atmospheric data at every time step. What was special about ENIAC was that it was electronic (faster than mechanical) and programmable (making it general-purpose, but before stored programs). The computations on a grid were a major step towards fulfilling the dream of the forecast factory, even if it required tedious programming in the days when code was set by hand on rows of dials and every result had to be punched onto cards.
In the end, they had 24-hour forecasts, each of which had taken about 24 hours to compute. They had barely kept pace with the weather, and technically they were hindcasts. Still, the maps looked convincingly like weather, and became a critical proof of concept for a new world of numerical weather prediction. All it needed was to receive ever-more realistic models and observations of the atmosphere. In the few short years from D-Day to the historic 1950 forecast, the foundations were set for the basic methods of forecasting used today.
- Radiosondes 1930s
- Ground radar 1950s
- Weather satellites 1960s
- GPS radio occultation 2000s
- AI weather models 2020s
New frontiers, old problems
In 1904, the Norwegian meteorologist Vilhelm Bjerknes argued that predicting the weather came down to two problems: knowing the present state of the atmosphere accurately enough, and knowing the laws by which one state turns into the next. Computers eventually solved a third: actually solving this initial value problem fast enough to be useful.
In the seventy-five or so years since the first numerical forecast, all three have flowered. More observations, better physics, faster machines. Balloons carried instruments into the upper air; radar opened up the insides of storms; satellites brought the whole planet into view at once. We found ways to pull these raw observations into a physically realistic model state. Models of many kinds grew from a single layer of the atmosphere into decent forecast machines and laboratories for the Earth system. Computers, once barely keeping pace with the weather, now run ten-day global forecasts in about an hour.
Yet, observations remain thin in most of the world, too often leaving us unprepared for the extreme weather we’ve gotten a lot of lately. Like Richardson’s forecast, and those of the foreseeable future, today’s forecast error mostly comes down to not knowing the initial state well enough. Ah, it might just be the atmosphere’s oldest trick in the book.
References and further reading
- De Young, G. (1985). The storm controversy (1830–1860) and its impact on American science. Eos, 66(38), 657–660.
- Frisinger, H. H. (1973). Aristotle’s legacy in meteorology. Bulletin of the American Meteorological Society, 54(3), 198–204.
- Frisinger, H. H. (1977). The History of Meteorology: to 1800. Science History Publications.
- Blum, A. (2019). The Weather Machine: A Journey Inside the Forecast. Ecco.
- Lynch, P. (2006). The Emergence of Numerical Weather Prediction: Richardson’s Dream. Cambridge University Press.
- Redfield, W. C. (1831). Remarks on the prevailing storms of the Atlantic coast, of the North American States. American Journal of Science and Arts, 20(1), 17–51.
- Redfield, W. C. (1843). Observations on the storm of December 15, 1839. Transactions of the American Philosophical Society, 8 (New Series), 77–80.
- Richardson, L. F. (1922). Weather Prediction by Numerical Process. Cambridge University Press.