In February, we announced our record-breaking AI-based global forecasting model, WeatherMesh, with key benchmark results. In that release, we shared for the first time that our model had surpassed both AI-based and physics-based forecasts in predicting key metrics, such as 500 millibar geopotential height, a measure of pressure that describes the movement of weather systems at the midlayer of the atmosphere. (We evaluate this metric at a standard 0.25-degree resolution.)
While those results capture an important milestone, we’re excited to make an even broader set of major forecasting benchmarks for WeatherMesh available to everyone, in real-time.
Now anyone can view WeatherMesh’s real-time performance for key weather variables on our new, public Benchmarks page, including:
- 500mb geopotential, actual outputs and RMSE
- 500mb u-wind RMSE - A measure of wind in the direction of increasing longitude, from west to east
- 500mb v-wind RMSE - A measure of wind in the direction of increasing latitude, from south to north
- 2m temperature RMSE - A measure of temperature 2m above the ground surface
Root mean square error (RMSE) is a measure of the inaccuracy of a measurement. We’ve made RMSE available in real-time for each of our variables in 24-hour increments, as shown in tables 1-4 on our new Benchmarks page.
Download Our Forecasts
In addition to publishing RMSE for these key variables, we’re also sharing WeatherMesh’s actual 500mb geopotential forecast outputs at a 24-hour resolution publicly. (Our models generate forecasts at one-hourly resolution every six hours, however we are sharing models at 24-hour resolution for competitive reasons).
To download and read WeatherMesh’s hourly output as .npy files, you can use this example script and consult our API documentation. Please feel free to conduct your own analysis to check our work.
We’re offering other raw model outputs selectively to researchers. If you are a researcher who would like to request fuller access, please get in touch at contact@windbornesystems.com.
How to Read Our Benchmarking Tables
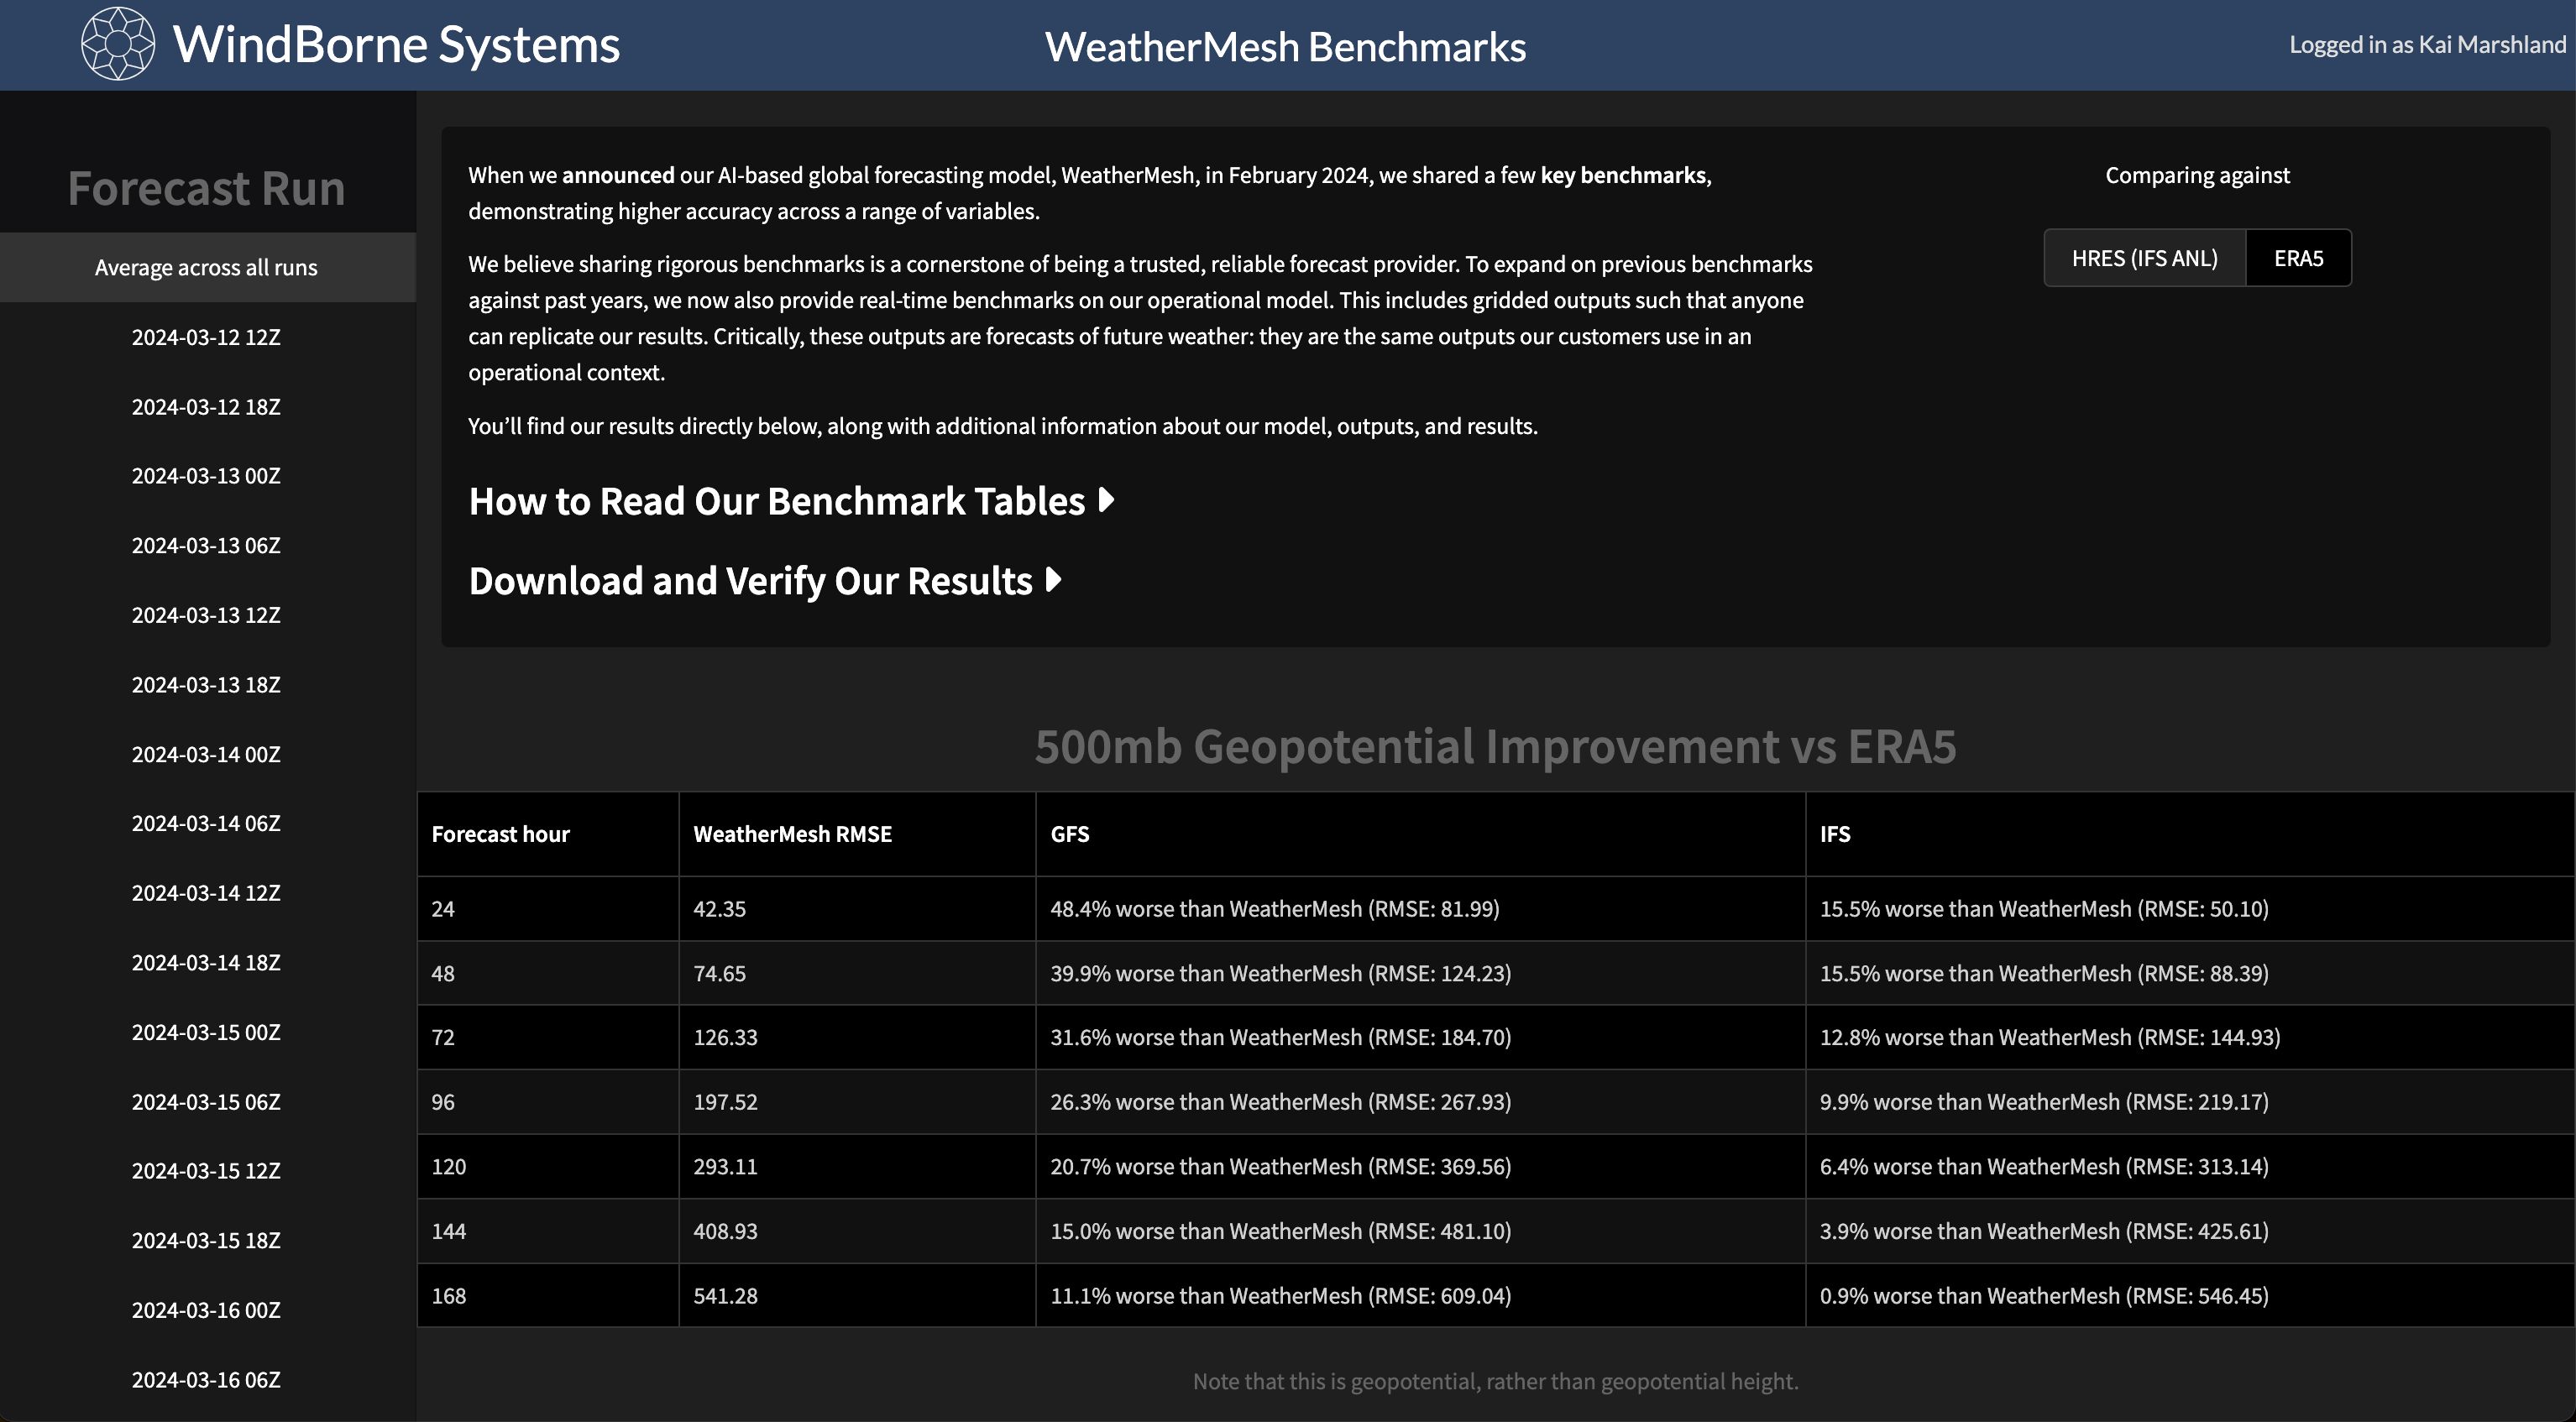
For each of the four weather variables – 500mb geopotential, 500mb u-wind, 500mb v-wind, 2m temperature – you can directly compare WindBorne WeatherMesh’s predicted output (the forecast for each variable at 24-hour resolution) with how the weather actually played out. This measurement is represented through root mean square error (RMSE), which is a measure of the inaccuracy of a measurement. The lower the error, the more accurate the prediction.
Our Benchmarks page makes it easy to compare WindBorne’s forecasts for each variable with two representations of the “real” or actual weather: the ECMWF’s HRES forecast at forecast hour zero (also known as the IFS analysis), or the ERA5 reanalysis (an after-the-fact renanalysis of the historical atmospheric state based on measurements of what actually happened).
ERA5 is generally considered the gold standard representation of actual weather; HRES at forecast hour zero is the best near-real-time estimate (ERA5 can take a week to come out). You can use the HRES and ERA5 buttons in the upper right corner of the Benchmarks page to compare our results with each data set.
Each variable’s RMSE table follows the same information structure, from left to right: Forecast hour, WeatherMesh RMSE, the National Weather Service’s GFS forecast (% difference from WeatherMesh), and ECMWF’s IFS forecast (% difference from WeatherMesh).
Finding Specific Forecasts
To review a forecast created at a specific point in time, also known as an “initialization time,” select your time of interest using the tabs on the left of the benchmark page. As an example, in 2024-03-12 18Z, the “Z” stands for Zulu time, or Coordinated Universal Time (UTC), the world-wide 24-hour clock standardly used in meteorology. In this example, 18Z is 4am Central Time (CT).
The default table view, in the absence of selecting a specific initialization time, reflects the average across all forecast runs since the inception of the Benchmarks page, on March 12, 2024.
To check out our recent and upcoming case studies about WeatherMesh, check out our Blog.